
The economy has been going strong for nine years, one of the longest economic expansions in the United States on record. But some event will ultimately end it. While it will be tough to predict the timing, severity and length of the next recession, we can identify a key growing threat (debt) exacerbated by the growing wealth divide and the lack of potent central banking tools that can make the next recession more severe than the one of 2008.
Excessive corporate and consumer debt compounded with the synchronization of the short term and long term debt cycles is most likely going to cause the next financial crisis (A.K.A. Debt Crisis). Unlike the financial Crisis of 2008 (Where policy makers had plenty of monetary policy options and cash to recapitalize the financial system) this time around central banks will have fewer and less effective monetary policy options, which may result in a once in a lifetime financial crisis similar to that of 1937. I will cover the four threats below and discuss how investing in “Opportunity Funds” may be the unconventional solution to prevent a severe recession from occurring and eventually close the wealth gap that exists in this country.
- The Wealth Divide between the haves and have-nots
- The Short-Term Debt Cycle (Typical length of 5-10 years)
- The Long-term Debt Cycle (Which typically takes about 50 to 75 years to play out)”
- Lack of Central Bank Tools
The Growing Wealth Divide In America
Currently, the richest 1% of Americans hold about 38% of all privately held wealth in the United States. while the bottom 90% of Americans held 73.2% of all debt. According to The New York Times, the richest 1 percent in the United States now own more wealth than the bottom 90 percent. America’s 1% hasn’t controlled this much wealth since before the Great Depression. These are just a generic set of statistics with just a vague understanding of the financial disproportion happening at the middle class level of the economy.
To get a good visual of this wealth gap, imagine that you were invited to a Super Bowl party and there was one pie that will be divided into 100 pieces based on each of your net worth (total asses-total debt). This is how the pie would be divided. The top 20% of earners in this country would get 90 slices. That leaves just 10 percent of the pie for the remaining 80 percent of the populace or party. The next 20% would get 8 pieces. The middle 20% would get 2 slices and the bottom quintile 40% would get none. Actually the bottom 20% would owe a slice meaning they would owe more than their negative net worth of -$8,900.00. Below Bridgwater Associates was able to get a bit more granular with their data.
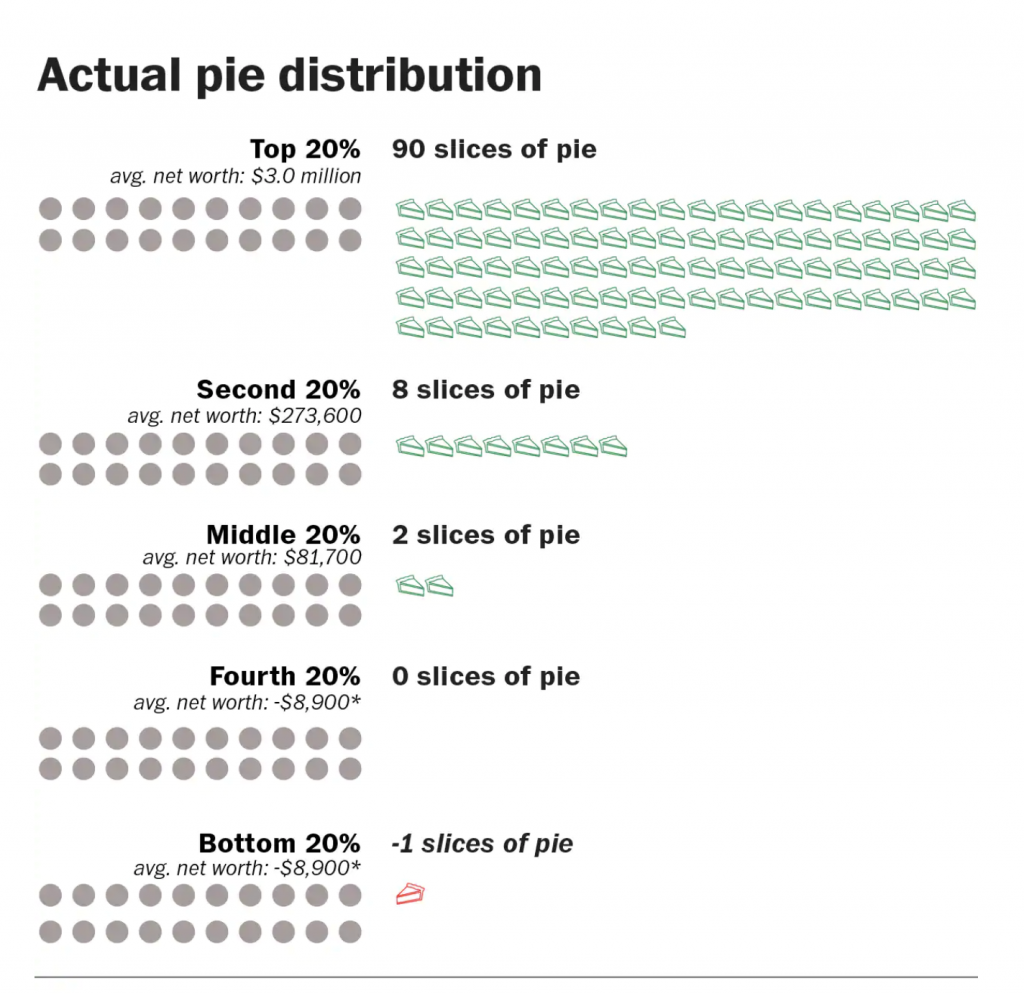
Pie Icon by: Theresa Berens, The Noun Project
In the Daily Observations published by Bridgewater dated October 23, 2017 the publication labeled these The Two Economies: The Top 40% and the Bottom 60%. In their research they focused mainly on the bottom 60%, because the people in the top 40% have a very unclear idea of what the people in the bottom 60% are experiencing on their income. Here is Bridgewater’s findings:
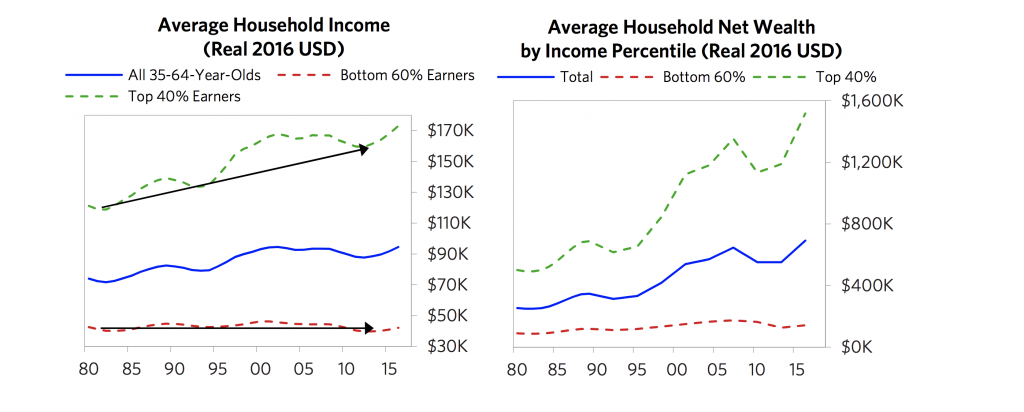
There has been no growth in earned income, and income and wealth gaps have grown and are enormous. Since the 1980s, median household real incomes have been about flat, and the average house hold in the top 40% of earns four times more than the average household in the bottom 60%. Those in the top 40% now have on average 10 time as much wealth as those in the bottom 60%. Only about a third of the bottom 60% saves any of its income and according to a Federal Reserve Study, would struggle to raise $400.00 in an emergency.
The Rates of income and wealth changes of the middle class have been worse than those changes in any other groups, once you account for the social safety of net and taxes. The middle class has experienced less post-tax and transfer income growth than the bottom quintile since 1980, partially because the government support to the bottom has provided more of a cushion–though in both cases, income growth has been very low.
The middle class has been especially hard-hit by manufacturing job declining about 30% since 1997. Bridgewater does not elaborate on this point but there is compelling evidence that in the late 1980’s till the late 1990s is when a good portion of U.S. manufacturing was being outsourced to China as a result making China the number two economy in the world at the expense of the American middle class.
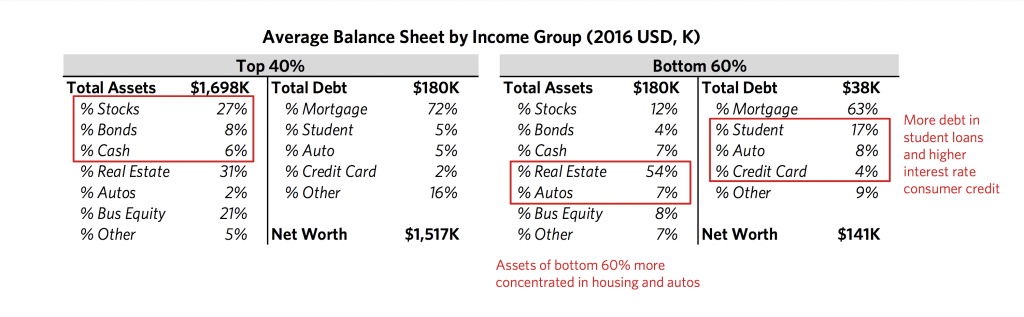
Those in the top 40% have benefited disproportionately from changes in asset values relative to those in the bottom 60%, because of their asset and liability mix. The balance sheets of these two groups, shown below, are sharply different. Though the bottom 60% has a small amount of savings, only a quarter of it is in cash or financial assets; the majority is in much less liquid forms of wealth, like cars, real estate, and business equity. For the bottom 60%, debt is skewed toward more expensive student, auto, and credit card debt.
The increasing disparity in financial conditions is a major cause of the slowing of growth, because those in lower income/wealth groups have higher propensities to spend than those in higher income/wealth groups. Although Bridgewater tries to clarify their point above, I believe I can make the point more clear. Basically if the wealthy had a choice to spend or invest any additional money made, they would most likely invest the additional money in appreciable liquid assets rather than on consumable products or depreciating assets. Whereas, if you give lower income groups money, they will spend most of the money because their vision of wealth is based on the consumption of depreciable assets that require debt financing as described in the balance sheets above.
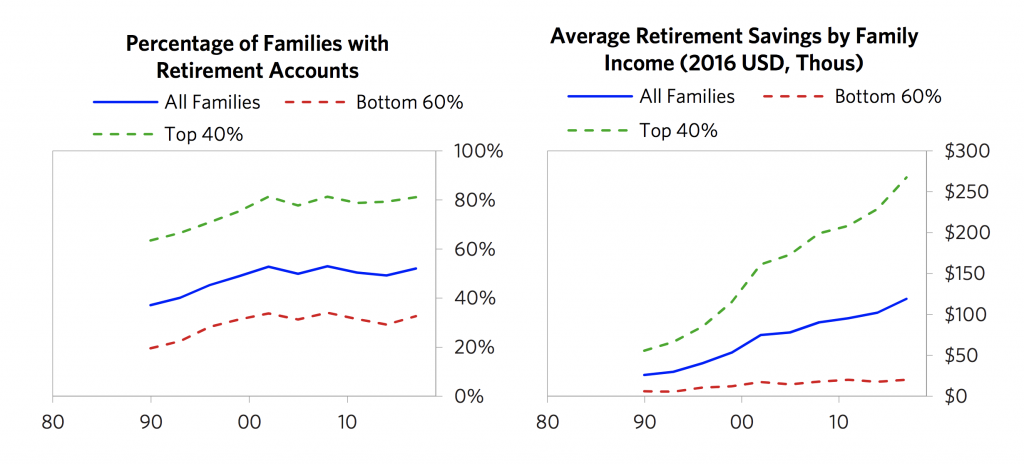
Retirement savings for the bottom 60% are not even close to adequate and aren’t much improved as the economy and markets have recovered. Only about a third of the families in the bottom 60% have retirement savings accounts-e.g. pensions, 401(k)s–which average less than $20,000.00.
The top 40% spend four times more on education than the bottom 60%. This creates a self-perpetuating problem, because those at the bottom get much worse education than those at the top. I would like to thoughtfully disagree with Bridgewater on this point. I don’t think the bottom 60% get a much worse education, I think the bottom 60% have access to highly qualified public school teachers who require more certifications than private school teachers. The average salary of a teacher in America is $58,950.00, whereas the average salary of a private school teacher is $36,250.00. So what’s the difference between public and private schools? Access. The top 40% have access to more people who are well-connected. Wealthy parents plus private school equals more connections and access. Access to each other, access to top tier universities, access to better jobs and access to better opportunities they didn’t even know existed. I agree that Public schools have not evolved to prepare students for 21 century careers and are short on many resources, that needs to change. If the bottom 60% get a much worse education its because the few that do not value their teachers or their free education make the experience worse for those around them who do value education. And because of this culture for disrespecting educators and education dominates, it has become downward self reinforcing in the communities that allow it to happen. Aside from that access is the key differentiator.
I selected only the most relevant financial statistics from Bridgewater’s Daily observations for the purpose of this article. They report several other statistics and graphs that cover the wealth divide in a bit more detail here. Although the study was dated October 2017 and was most likely based on previous years statistics, I believe that as of 2019 there may only be a slight improvement in these statistics but not enough to close the gap between these two groups.
This is a problem because most Americans in the bottom 60% have not fully recovered from the 2008 financial crisis, and as the economy begins to cool down…debt and debt service payments for the bottom 60% will eventually rise faster than their income. This happens because when people borrow money during good economic times, they are essentially borrowing from their future selves assuming their income will be higher in the future generally when the economy is retracting. They are also creating a time in the future where they should be spending less than they make so they can pay down the debts. This generally happens because as you can see from the balance sheet (above right) the bottom 60% use more debt to purchase non income producing liabilities like mortgages, car loans, and credit card debt.
When the economy eventually heads into a recession and debts begin to rise while debt service costs rise even faster, the bottom 60% will have a hard time meeting these obligations and thats when the stress between the two groups will begin to heat up resulting in protests, new pressures on congress to penalize and tax the top 40% along with social unrest. These events will be exacerbated by the the timing of the long-term debt cycle and short-term debt cycle hitting at the same time while the lack of monetary policy options used to stimulate will be severely limited as described below.
To get a really good understanding of how the markets and economies work check out this short video by Ray Dalio of Bridgewater titled “How the Economic Machine Works.” Its a good visual tool to understand the basics of the short-term debt cycle, the long-term debt cycle and the monetary policies that affect both. Below is a summary of the long-term debt cycle, short-term debt cycle and the monetary policies used to keep them in check. To get a detailed understanding of debt crises Ray Dalio has put out a manual called: A Template for Understanding Big Debt Crises.
The Short-Term Debt Cycle
On average a short-term debt cycle lasts around 5-10 years, and its length is determined by current demand for credit as well as the monetary policies that were implemented during the previous short-term debt cycle of 2008. According to Ray Dalio, “We are in the “late-cycle” of the short-term debt cycle.” In his book, “A Template for Understanding Big Debt Crises” that would mean we are nearing the end of the bubble stage (48 to 120 months in length) and close to the top (12 to 18 months) meaning we are getting closer to a recession. He states, “The strong demand for credit, rising prices/inflation and eventually central banks’ tightening of monetary policy to put the breaks on growth and inflation, causes stock and other asset prices to fall. They fall because all investment assets are priced as the present value of their future cash flows and interest rates are the discount rate used to calculate present values, so higher interest rates lower these assets’ present values. Also, tighter monetary policy slows prospective earnings growth, which makes assets worth less.” As of January 2019 the economy appears to be strong and unemployment is at its lowest in history, however the market tremors will begin to slowly creep in. As we exit the bubble phase and enter the top or recession phase… the yield curve inverts, unemployment is at its lowest and inflation rates begin to rise…all current economic signals happening right now as all assets start to become worth less due to the rise in interest rates. As Ray Dalio puts it, “We are now seeing this classic late-cycle strong profit growth and strong economic growth that is accompanied by falling stock prices due to the financial squeeze.”
The Long-Term Debt Cycle
The long-term debt cycle, rolls around approximately once every 50-75 years due to the compounding of subsequent short-term debt cycle’s steady rise of higher debt and debt service burdens, which the central banks try to neutralize by lowering interest rate, but when that lever fails to work, the next lever is to print money and buy debt. Ray Dalio states, “When the risk-free interest rate that they control hits 0% in a big debt crisis, central banks lowering interest rates doesn’t work. This time around the tightening is coming via both interest rate increases and the Federal Reserve reducing its holding of the debt it had acquired. For all the previously described reasons, the period that we are in now looks a lot like 1937.” Basically what he is saying is as we get closer to the end of the long-term debt cycle the tools used to manage the economy are not as affective and when they are no longer affective that signifies that we are at the end of the long-term debt cycle. Dalio says, “The proximity to the end can be measured by a)The proximity of the interest rate to zero and b) the amount of remaining capacity of central banks to print money and buy assets and the capacity of these assets to rise in price.”
Ray Dalio recently stated in his recent linkedin article titled “To Help Put Recent Economic & Market Moves in Perspective”, “Right now, the world’s major central banks have the least fuel in their tanks since the late 1930s so we are now in the later stages of the long term debt cycle. Because the key turning points in the long-term debt cycle come along so infrequently (once in a lifetime) , they are not well understood and take people by surprise. So, it appears to me that we are in the late stages of both a short-term and long-term debt cycles. In other words, a) were are in the late-cycle phase of the short-term debt cycle when profit and earnings growth are still strong and tightening of credit is causing asset prices to decline, and b) we are in the late-cycle phase of the long-term debt cycle when asset prices and economies are sensitive to tightening and when central banks don’t have much power to ease credit.”
Several other well know Billionaires and economists have also come to the same conclusion.
Davos January 17th, 2019: Central banks lack the weapons to fight the next big recession
“If we have a recession, I think it’s going to be worse than normal,” said Kenneth Rogoff, a professor at Harvard University and former chief economist at the International Monetary Fund in a recent CNN article. “It will be more difficult to respond.”
In a CNBC article dated January 22, 2019 CNBC quoted Seth Klarman, a hedge fund billionaire some call the next Warren Buffett, wrote a sobering letter warning his investors of the economic impact of global tension, rising debt and the pervasive political divide. Klarman also warned about growing debt levels, pointing out that total U.S. government debt now exceeds GDP, a level that other countries like Canada, France, Britain and Spain are approaching. “The seeds of the next major financial crisis (or the one after that) may well be found in today’s sovereign debt levels,” he said.
When a debt crisis eventually occurs there are only three types of Monetary Policies that act as effective levers to balance the severe swings between deflationary and inflationary forces.
Monetary Policy 1
Interest -rate driven monetary policy
The first Monetary Policy and one most often used by the central banks is the raising and lowering of interest rates. This lever works the fastest and has the broadest impact on the economy because nearly every person and organization relies on interest rates to fund both short term and long term purchases bought with credit. When central banks lower interest rates it stimulates a country’s economy by lowering debt service payments for borrowers and provides a wealth affect by allowing the borrower to keep more cash on hand to either spend or invest versus paying it in interest. Lower interest rates naturally increases the present value of investments because interest rates serves as the benchmark or discount rate used to value investments.
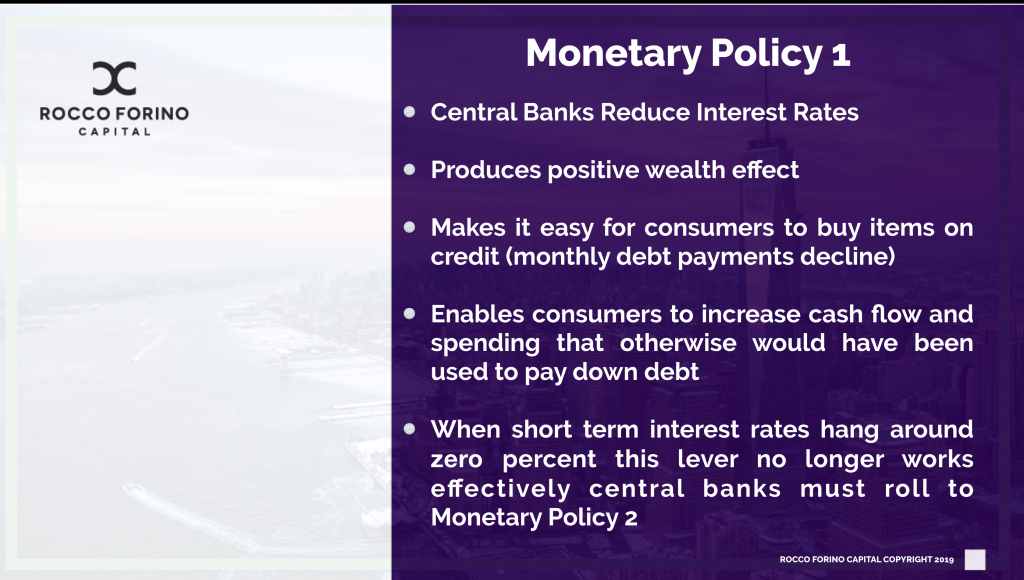
During the 2008 financial crisis, Central Banks took dramatic steps to prevent economic collapse by slashing interest rates, and in the subsequent years that followed spent trillions recapitalizing banks and buying financial assets as part of an effort to spur economic growth. Since the central banks kept interest rates too low for too long the result is an accumulation of cheap debt that now needs to be paid back. When debt and debt service payments rise faster than the income that needs to pay them down, a deleveraging or (reduction in debt to income ratios) must occur. And because the federal reserve has kept interest rates as close to 0 percent for so long, this monetary policy option will no longer be able to be effective during the next economic down turn, which is when debt and debt service (as a percentage of income) rise faster than the income needed to pay the debts down.
Since we are experiencing the synchronization of the short term and long term debt cycle, and because interest rates have remained so low for nearly a decade, lowering interest rates to stimulate the economy will become less effective and central banks must roll on to the second monetary policy called quantitative easing (QE).
Monetary Policy 2: “Quantitative Easing” (QE)
As explained in Dalio’s manual A Template for Understanding Big Debt Crises, “QE is the “printing of money” and buying financial assets typically debt assets. The raising and lowering of interest rate affects borrowers and spenders, QE affects savers and investors, because when the central bank buys a bond it provides the investor/saver with cash to buy a more attractive financial asset.” When these investors/savers invest in assets that finance spending, the economy gets a stimulating boost. Because this type of monetary policy positively affects investor/savers or the people who own financial assets, this particular monetary policy mostly exacerbates and widens the wealth gap between the top 40% and lower 60%.
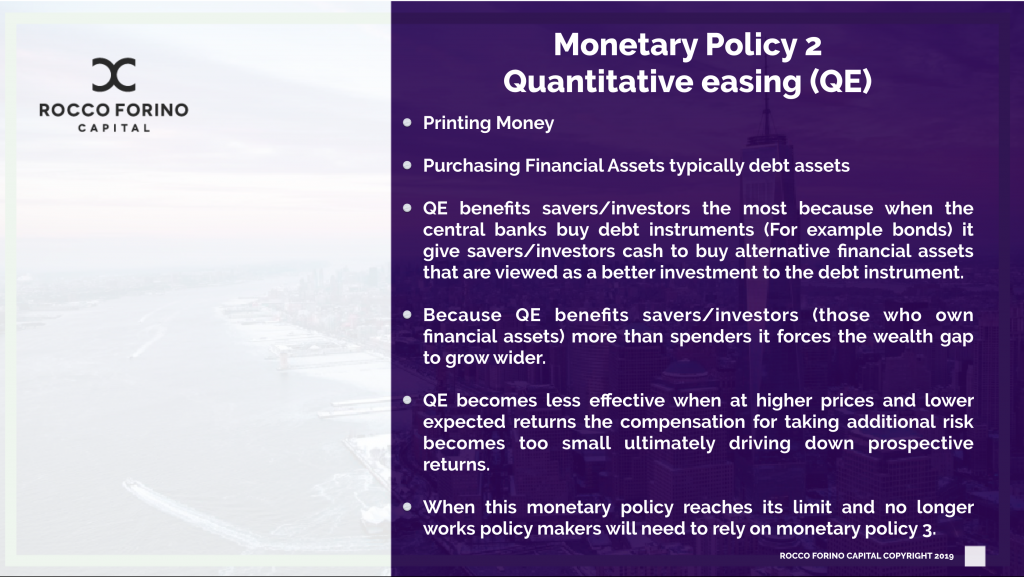
In 2008 the Central Bank had pumped a tremendous amount of liquidity into the markets (around 2 trillion dollars) by purchasing debt and “printing money” ultimately preventing a financial collapse and lessening the severity of the recession that ensued. And Since the use of QE was used to stimulate the economy in 2008, this monetary policy will be less effective in during the next financial crisis because risk premiums are already pushed down and asset levels are currently pushed up so high that there is barely any room to move higher, which ultimately causes the wealth effect to diminish. When that happens investors start to weight the risk-to-reward ratio and start to view cash as more appealing than holding long term assets. According to an article by Business Insider dated January 9th 2019, cash was the best performing asset in 2018. And this is when Monetary Policy 2 will become less effective during the next recession.
Monetary Policy 3: Putting Money Directly into the hands of spenders instead of investors/savers with the condition to spend the money.
During the next impending recession, putting money directly in the hands of spenders may be more effective than the first two monetary policies and will have an immediate and positive affect on the economy. This method of distributing money to every pocket of the economy would be stimulative and productive. Other programs that have worked in the past include providing veteran with bonuses, the Central Bank printing money to lend to the government for stimulus projects and a new option, universal basic income with the condition to spend it or lose it. This could work to stimulate the economy but may not be as effective as imagined.
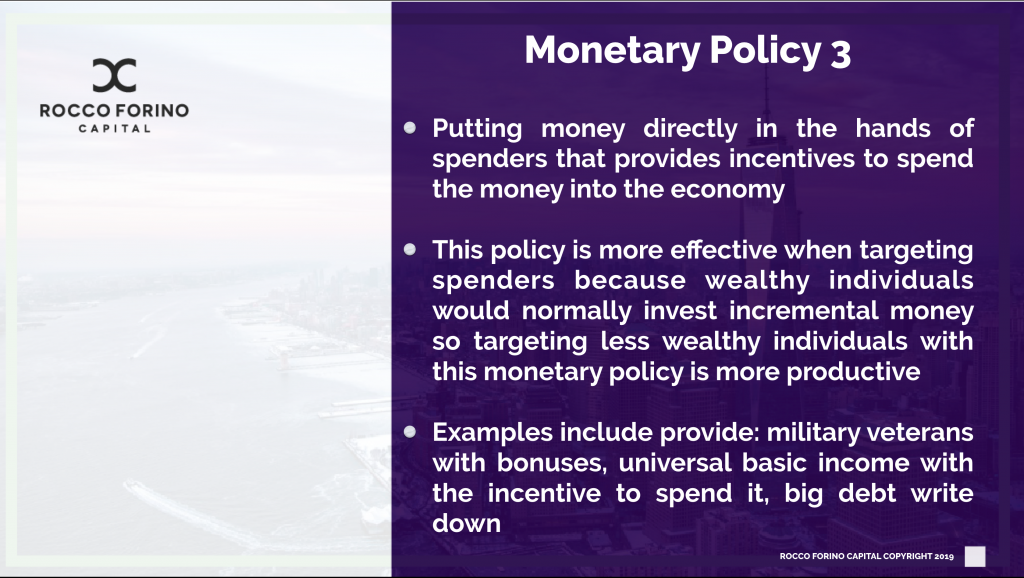
Because the ultra wealthy control a disproportionate amount of wealth relative to their spending…they do not have the need to buy 50,000 homes, 100,000 vehicles or 1 million dollars worth of groceries in a year and therefore targeting this group will not encourage the spending needed to stimulate the economy when it will be needed the most. Taxing this group will only exacerbate tension, and waste time when better alternative are available.
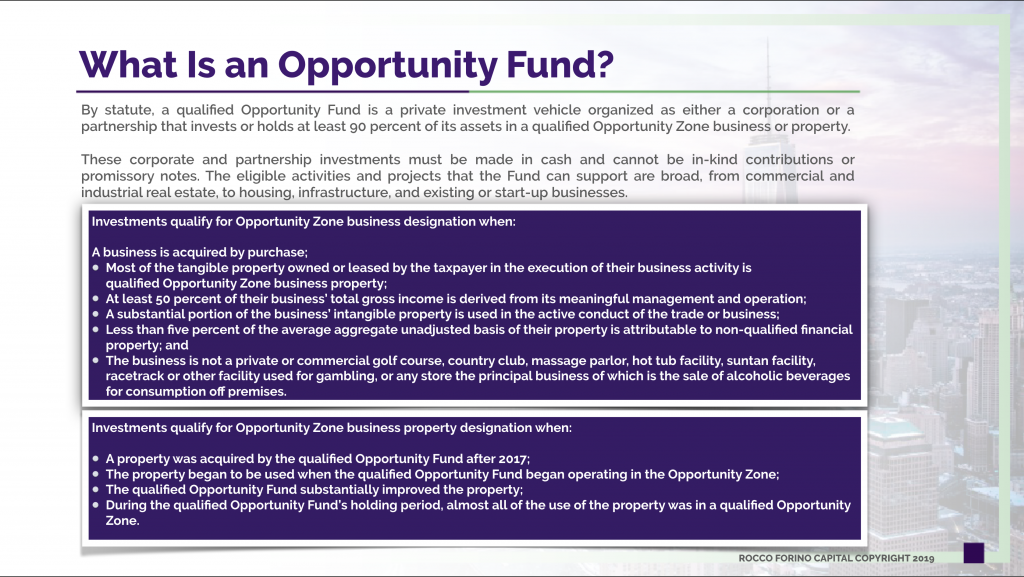
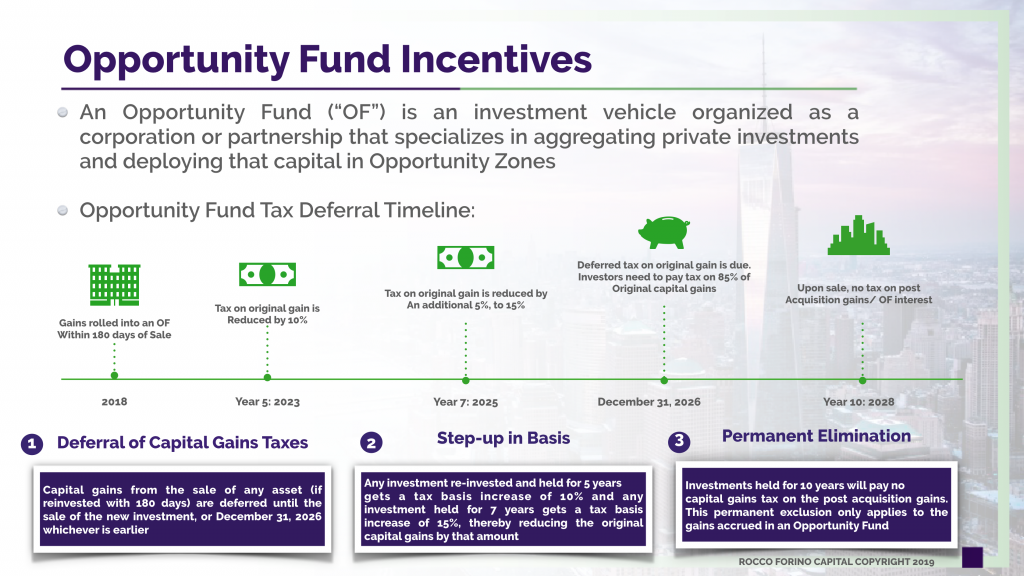
Opportunity Zone Investing
When policy makers react to debt crisis’s they don’t always use an exclusive version of the three monetary policy options and may develop a hybrid of two or more of the three monetary policies listed above. Opportunity Zone investing appears to be a unique hybrid of Monetary Policy 2 and 3. Under monetary policy 2, Opportunity Funds provide investors/savers the opportunity to invest in alternative financial asset (Opportunity Zones i.e. Distressed communities) by using their capital gains to receive impressive tax incentives in addition to receiving potentially attractive return on investments all while fitting into the investors social impact investing goals. Under monetary policy 3, policy makers have created an incentive for private money to directly flow into Opportunity Zones (distressed communities) by investing in real estate, direct businesses and startups. This is much more effective than handing out money, because now the wealthy will have an equity stake in these communities ultimately wanting them to succeed. This legislation encourages investors to invest in Opportunity Zones by putting money directly into the hands of communities who need it most. This monetary policy provides hard working citizens with access to capital they otherwise wound never had access to, and tax incentive and investment gains for investors, resulting in a a win win for both spenders and investors and the United States.
The greatest asset to the economy right now is that investing in Opportunity Zones is preemptive pre-recession investment option that can be deployed immediately, which is better than waiting for a recession to happen first and then waiting on policy makers to agree on a solution and reacting to a financial crisis later, when at that point…will already be too late. Investing in Opportunity Zones can happen immediately and if the investments can be deployed efficiently into these communities, the U.S. economy can avoid a potentially severe and drawn out recession.
Policy makers have already done their jobs and passed the Opportunity Zone legislation which can be the most socially impactful piece of legislation to benefit American citizens (both investor and spenders) in its history. The question is, will asset managers and investors start moving capital gains into Opportunity Funds when there still is enough time and positive capital gains to actually deploy, or will they try to edge it out a bit longer potentially eroding most if not all of the capital gains available and any hope of getting Opportunity Zones to become the next economic engine to benefit to the entire U.S. economy when it will be needed the most.
As of January 21, 2019 some policy makers are calling for a 70% top marginal income-tax rate on earned incomes of $10 million or more. Others are suggesting that earned income is not the real source of tax revenue, but taxing capital gains, dividends and earned interest. Senator Elizabeth Warren has proposed a separate plan that would require the top 75,000 households to pay an annual tax of 2 percent on each dollar of their net worth above $50 million. It would rise to 3 percent on every dollar above $1 billion. On February 1, 2019 Michael Hiltzik of the LA Times wrote a column titled: “America is Falling Out of Love with Billionaires, and its About Time. If this is the conversation now and it seems to be getting public approval, its going to get way more serious and furious once a severe recession hits and social unrest kicks in. Taxing the rich will be the slogan once again and divisions will be even deeper than the last recession.
In the next 12 to 18 months, timing will be everything. The preemptive shifting of assets will allow investors to:
- Prevent a severe and drawn out recession
- Rebuild and recapitalize distressed communities throughout the United States
- Take an equity stake in distressed communities with the desire for them to succeed
All while easing social tensions and essentially closing the wealth gap between both groups.
Rocco Forino is the Managing Partner of Rocco Forino Capital, a value investing company de-risking investments in Opportunity Zones and OZ Funds by educating investors, stakeholders and communities through our research, data analysis, investor relations tools, conferences and certification programs to create transparency, diversification and hyper focused deal flow for investors.
Since Opportunity Zones (Oz’s) are distressed communities and RFC specializes in the valuation of distressed assets, we are well-positioned to evaluate communities, real estate and businesses based on their ability to transition from being distressed to becoming the next thriving economic hub.
For more information about investing in Opportunity Funds click on the button below.


Leave A Comment